Charting the Landscape of Genetic Overlap Between Mental Disorders and Related Traits Beyond Genetic Correlation
Abstract
Objective:
Mental disorders are heritable and polygenic, and genome-wide genetic correlations (rg) have indicated widespread shared genetic risk across multiple disorders and related traits, mirroring their overlapping clinical characteristics. However, rg may underestimate the shared genetic underpinnings of mental disorders and related traits because it does not differentiate mixtures of concordant and discordant genetic effects from an absence of genetic overlap. Using novel statistical genetics tools, the authors aimed to evaluate the genetic overlap between mental disorders and related traits when accounting for mixed effect directions.
Methods:
The authors applied the bivariate causal mixture model (MiXeR) to summary statistics for four mental disorders, four related mental traits, and height from genome-wide association studies (Ns ranged from 53,293 to 766,345). MiXeR estimated the number of “causal” variants for a given trait (“polygenicity”), the number of variants shared between traits, and the genetic correlation of shared variants (rgs). Local rg was investigated using LAVA.
Results:
Among mental disorders, ADHD was the least polygenic (5.6K “causal” variants), followed by bipolar disorder (8.6K), schizophrenia (9.6K), and depression (14.5K). Most variants were shared across mental disorders (4.4K–9.3K) and between mental disorders and related traits (5.2K–12.8K), but with disorder-specific variations in rg and rgs. Overlap with height was small (0.7K–1.1K). MiXeR estimates correlated with LAVA local rg (r=0.88, p<0.001).
Conclusions:
There is extensive genetic overlap across mental disorders and related traits, with mixed effect directions and few disorder-specific variants. This suggests that genetic risk for mental disorders is predominantly differentiated by divergent effect distributions of pleiotropic genetic variants rather than disorder-specific variants. This represents a conceptual advance in our understanding of the landscape of shared genetic architecture across mental disorders, which may inform genetic discovery, biological characterization, nosology, and genetic prediction.
Mental disorders are among the most heritable complex human disorders. For schizophrenia, bipolar disorder, depression, and attention deficit hyperactivity disorder (ADHD), twin studies have estimated broad sense heritabilities of 40%–80% (1–4). Genome-wide association studies (GWASs) have since shown that approximately one-third is driven by thousands of common genetic variants, each with individually small effect (5). As ever-expanding GWAS sample sizes bring genetic prediction and stratification tools closer to the clinic (6), a better understanding of the complex genetic architecture of mental disorders is needed to address questions regarding disease classification and the potential for precision medicine in psychiatry.
Larger GWAS sample sizes have also revealed extensive shared genetic risk variants across diagnostic categories, mirroring their overlapping clinical characteristics (7). A meta-analysis of eight mental disorders identified 109 independent genetic loci associated with two or more disorders (8). Interestingly, 11 of these had “discordant” effects, that is, they increased the risk of one disorder but decreased the risk of a second (8). This is supported by findings from pairwise analyses (9, 10) that have identified hundreds of shared loci between mental disorders and related traits such as intelligence (11, 12) and personality traits (13), with a mixture of concordant and discordant effects (Figure 1A). Such extensive “pleiotropy” calls into question the traditional conceptualization of genetic risk, in which a specific set of genes is implicated for a specific disorder (14).

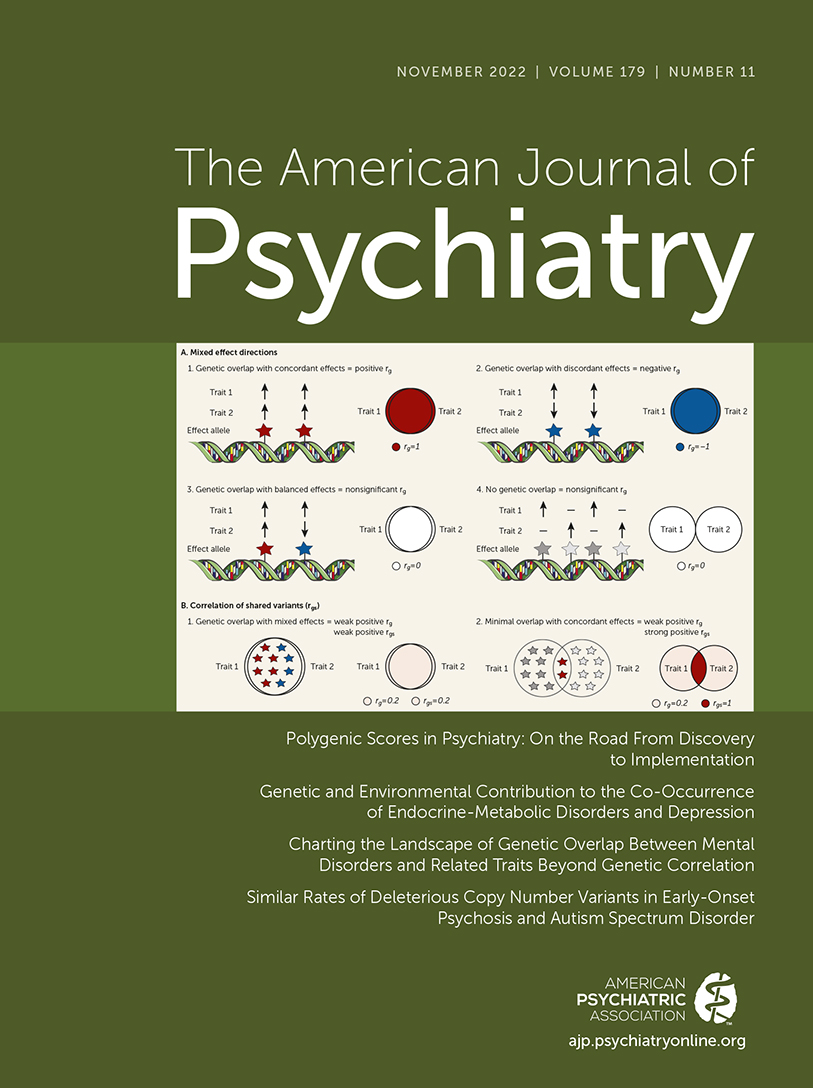
FIGURE 1. MiXeR model concepts: features of genetic overlap beyond genetic correlation (rg) characterized by MiXeRa
aPanel A illustrates mixed effect directions. While rg captures genetic overlap with predominantly concordant (scenario 1) or discordant effects (scenario 2), it is incapable of differentiating genetic overlap with a balance of concordant and discordant effects (scenario 3) from an absence of genetic overlap (scenario 4), returning an estimate of 0 in both scenarios. In contrast, MiXeR quantifies the number of shared “causal” variants (Venn diagrams), and so it also identifies genetic overlap in the presence of mixed effect directions. Panel B illustrates the correlation of shared variants (rgs). rg does not differentiate extensive genetic overlap with a small majority of concordant effect directions (scenario 1) from smaller overlap with a majority of concordant effect directions (scenario 2), returning weak positive rg in both scenarios. In contrast, MiXeR-estimated rgs returns an equivalent estimate to rg in scenario 1 but a higher estimate in scenario 2 (the same concept applies to weak negative rg or discordant scenarios).
Nonetheless, most “causal” genetic variants are yet to be discovered at genome-wide significance. “Genome-wide” approaches have therefore been developed that quantify genetic overlap beyond genome-wide significance, providing a bird’s-eye view of the landscape of shared genetics across disorders and traits. For example, linkage disequilibrium (LD) score regression genetic correlation (rg) returns a summary measure of the correlation of all single-nucleotide polymorphism (SNP) effect sizes (15). When applied to 10 mental disorders, this revealed widespread weak to moderate positive correlations, with strong positive correlations between schizophrenia and bipolar disorder and between anxiety disorders and depression (16).
Although rg is an informative measure of the genetic similarity between two phenotypes, it does not capture all dimensions of genetic overlap. Shared genetic variants can have either concordant or discordant effects (12, 17, 18). However, since rg is a genome-wide summary measure, it does not differentiate genetic overlap with a mixture of concordant and discordant effects from an absence of genetic overlap, returning an estimate close to 0 in both scenarios (Figure 1A). It is necessary to capture this “missing dimension” of genetic overlap to comprehensively describe the shared genetic underpinnings of polygenic mental disorders (17). Overlap despite minimal genetic correlation may indicate shared molecular mechanisms, with implications for how we conceptualize genetic risk for mental disorders.
The bivariate causal mixture model (MiXeR) (19) and LAVA (20) can shed light on this “missing dimension.” MiXeR circumvents the need to identify all “causal” variants by inferring the total number of “causal” variants for each trait (univariate) and the total number of shared and unique “causal” variants for a pair of traits (bivariate) (19). MiXeR also estimates the genetic correlation of shared variants (rgs), in addition to rg (Figure 1B). Using MiXeR, we have demonstrated extensive genetic overlap across several mental disorders and related traits with mixed effect directions (13, 18, 21). The relevance of mixed effects has been further emphasized by LAVA, which calculates local genetic correlations across the genome (20). Despite employing a distinct statistical framework, LAVA revealed widespread local genetic correlations across somatic and mental traits with mixed effect directions, even in the presence of minimal rg (20). However, neither MiXeR nor LAVA has been systematically applied across mental disorders and cognitive and personality traits using the largest-to-date GWASs.
We applied MiXeR and LAVA to large-scale GWASs of ADHD, bipolar disorder, schizophrenia, depression, and cognitive and personality traits to characterize their genetic overlap beyond rg. We aimed to map 1) polygenicity, 2) genetic overlap allowing mixed effect directions, 3) rgs, and 4) local genetic correlations, using height as a comparator. We compared MiXeR estimates of mixed effect directions to LAVA local correlations to validate our findings across two distinct statistical frameworks. By charting the landscape of genetic overlap beyond rg, we provide insights into the unique and shared genetic architectures underlying psychiatric disorders, with implications for how we conceptualize genetic risk for mental disorders and related traits.
Methods
Samples
We acquired summary statistics from large-scale GWASs of major mental disorders—ADHD, bipolar disorder, depression, and schizophrenia—as well as educational attainment, general intelligence (hereafter “intelligence”), neuroticism, subjective well-being, and height (Table 1; see also Table S1 in the online supplement) (15, 20–30). Phenotypes were selected based on available sample size and the quality of phenotyping procedures (see the Supplementary Methods section and Tables S2 and S3 in the online supplement). The final sample included 268,241 individuals with mental disorders and a combined sample size of 3,571,567, although there was participant overlap across samples (31). Given the confounding effect of ancestral differences in LD structure and the lack of sufficiently powered multi-ancestry samples, samples were restricted to European ancestry. The Regional Committee for Medical Research Ethics–Southeast Norway evaluated the study protocol and found that no additional institutional review board approval was necessary, as no individual data were used.
| Phenotype | Source | Phenotyping Strategy | Case Subjects (N) | Control Subjects (N) | Genome-Wide Locib |
|---|---|---|---|---|---|
| Mental disorders | |||||
| Schizophrenia | PGC-SCZ 3 (45) | Clinical diagnosis, structured diagnostic interviews, or health registry review | 53,386 | 77,258 | 177 |
| Bipolar disorder | PGC-BD 3 (46) | Structured diagnostic interviews or health registry diagnoses | 41,917 | 371,549 | 61 |
| Depression | PGC-DEP 2 + 23andMe (47) | Structured diagnostic interviews or health registry diagnoses of major depression or self-report of depression or clinical depression | 135,458 | 344,901 | 44 |
| ADHD | PGC-ADHD 2 (48) | Structured diagnostic interviews or health registry diagnoses | 19,099 | 34,194 | 12 |
| Mental traits | |||||
| Intelligence | CTG (49) | Neurocognitive test of intelligence or subdomains | 269,867 | 213 | |
| Educational attainment | SSGAC (including UKB) (50) | Self-reported years of completed education | 766,345c | 448 | |
| Neuroticism | CTG (51) | Questionnaire response to psychometric scale | 390,278c | 107 | |
| Subjective well-being | 23andMe (52) | Questionnaire response to ordinal item “How satisfied are you with your life?” | 252,053 | 4 | |
| Somatic comparator | |||||
| Height | GIANT (including UKB) (53) | Anthropometric measurement | 709,706 | 1,292 | |
TABLE 1. Overview of included samplesa
Modeling Polygenicity and Shared “Causal” Variants Using MiXeR
We applied MiXeR, version 1.3, to evaluate the unique and shared genetic architecture across our included phenotypes (19). MiXeR infers characteristics of the genetic architecture of complex traits based on GWAS summary data using Gaussian mixture models, a probabilistic model that assumes that a given data set can be modeled as a “mixture” of predefined components, each with its own Gaussian (normal) distribution.
MiXeR constructs a univariate mixture model for each trait, followed by a bivariate mixture model for cross-trait analysis, incorporating minor allele frequency, sample size, effects of LD structure, genomic inflation due to cryptic relatedness, and sample overlap into the model. First, univariate MiXeR assumes that, for each trait, common genetic variants are a mixture of “causal” variants and noncausal variants. Under this assumption, MiXeR estimates the polygenicity (π, the fraction of causal variants) and discoverability (σ2, variance of effect size per causal variant) for a given trait using maximum likelihood estimation. SNP-based heritability is derived from these estimates. To aid interpretation, polygenicity is presented as the number of causal variants with strongest effects required to explain 90% SNP-based heritability (h2SNP). A threshold of 90% is applied to prevent extrapolating model parameters into variants with infinitesimally small effects.
MiXeR is extended to a bivariate context by assuming that, for a pair of traits, common genetic variants can be described as a mixture of four components: shared “causal” variants, unique “causal” variants for trait 1 and for trait 2, and noncausal variants. Informed by the model parameters from univariate MiXeR for each trait, bivariate MiXeR estimates the shared component’s polygenicity irrespective of effect directions and correlation of effect sizes (rgs). The genome-wide genetic correlation (rg) and proportion of shared variants with concordant effects are derived from these model parameters. (See the Supplementary Methods section and Figure S1 in the online supplement for further details.)
Analogous to traditional significance testing, model fit is evaluated by calculating the difference between the Akaike information criterion (AIC) for best-fitting MiXeR estimates and a “reference” model. Positive AIC differences are interpreted as evidence that the best-fitting MiXeR estimates are distinguishable from the reference model. For univariate MiXeR, an “infinitesimal model” in which all variants are assumed to be “causal” is used as the reference. For bivariate MiXeR, the best-fitting model is compared to minimum possible overlap and maximum possible overlap. We provide log-likelihood plots in Figure S2 in the online supplement to visualize the parameter estimation procedure.
Computing Local Genetic Correlations With LAVA
We estimated pairwise local rg using LAVA (20). LAVA complements MiXeR by estimating local rg across 2,495 semi-independent genetic loci of approximately equal size (∼1 Mb) and is thus capable of identifying mixed effect directions despite minimal rg. LAVA differs from MiXeR because 1) it uses a distinct statistical framework based on a fixed-effects model, rather than MiXeR’s random-effects model, 2) it identifies specific shared loci, and 3) it is only a proxy measure of genome-wide genetic overlap, since the number of significantly correlated loci is, in part, influenced by the statistical power of input GWASs (20). After computing local h2SNP estimates for each trait, LAVA computes the matrix of local genetic covariance for each locus using the method of moments. Sample overlap was controlled using linkage disequilibrium score regression (22). Significance testing was performed using simulation-based p values. We used the false discovery rate (FDR) to adjust for multiple testing, reporting loci with FDR <0.05.
Comparing MiXeR and LAVA Estimates of Effect Direction
To test the hypothesis that MiXeR- and LAVA-derived measures of mixed effect directions were correlated, we calculated the Pearson correlation coefficient for 1) MiXeR-estimated proportion of shared “causal” variants with concordant effects and 2) LAVA-estimated proportion of significantly correlated genetic loci with positive correlation. These measures are comparable since both are proportions quantifying mixed genetic effects between two traits, with 0 indicative of completely discordant effects, 1 completely concordant effects, and 0.5 a balance of concordant and discordant effects. These measures differ as MiXeR estimates the effect directions of all shared “causal” variants, whereas LAVA only captures significantly correlated loci.
Data Availability
All data are publicly available or available on request (see Table S1 in the online supplement). MiXeR and LAVA code are available at https://github.com/precimed/mixer and https://github.com/josefin-werme/LAVA, respectively.
Results
Polygenicity
ADHD was the least polygenic mental disorder (N=5,600 “causal” variants explaining 90% of ADHD’s h2SNP, SD= 400), followed by bipolar disorder (N=8,600, SD=200) and schizophrenia (N=9,600, SD=200). Intelligence, neuroticism, and subjective well-being were estimated to be associated with 11,200–12,500 variants at 90% h2SNP, while educational attainment (N=13,200, SD=300) and depression (N=14,500, SD=700) were most polygenic (Figure 2). Height was less polygenic (N=4,000, SD=100). This pattern of polygenicity was distinct from h2SNP estimates (Figure 2). Heritability, discoverability, and power analyses are described in the Supplementary Results section, in Table S4, and in Figure S2 in the online supplement.

Figure 2. MiXeR-modeled genome-wide genetic overlap and genetic correlations and LAVA local correlations across bipolar disorder, ADHD, depression, and schizophreniaa
aAlong the diagonal, univariate MiXeR estimates for each mental disorder. h2SNP=SNP-based heritability estimate; polygenicity90=number (in thousands) of causal variants with strongest effects required to explain 90% SNP-based heritability. At upper right, MiXeR Venn diagrams show the number (in thousands) of shared and disorder-specific “causal” variants for each pair of disorders. Genome-wide genetic correlation (rg) and genetic correlation of shared variants (rgs) are represented by the color of the disorder-specific (rg) and shared regions (rgs), respectively. All analyses except depression and ADHD had positive Akaike information criterion (AIC) differences when comparing modeled estimates to minimum possible overlap but negative compared to maximum overlap, indicating that MiXeR estimates were indistinguishable from maximum overlap. For depression and ADHD, both AICs were negative, indicating that the analysis was not sufficiently powered to provide precise estimates of genetic overlap. Variation in polygenicity estimates for schizophrenia is due to variation in univariate MiXeR results across the 20 iterations. At lower left are volcano plots of LAVA local genetic correlation coefficients (rho) against −log10 p values for each pairwise analysis per locus. Larger dots represent significantly correlated loci after false discovery rate correction. MiXeR-estimated rg and rgs values and LAVA-estimated rho values are represented on the same blue to red color scale. ADHD=attention deficit hyperactivity disorder; BD=bipolar disorder; DEP=depression; SCZ=schizophrenia; SNP=single-nucleotide polymorphism.
Genome-Wide Genetic Overlap Beyond Genetic Correlation
Genetic overlap across mental disorders.
When MiXeR was applied to mental disorders, there was a pattern of extensive genetic overlap between the four mental disorders, with almost complete genetic overlap across all disorders (Figure 2; see also Table S5 in the online supplement). Further, AIC differences indicated that MiXeR-modeled overlap was not distinguishable from maximum overlap (see the Supplementary Results section in the online supplement). This pattern was most evident for schizophrenia and bipolar disorder, which were almost completely overlapping, with 8.5K (SD=0.3K) shared variants, 0.1K (SD=0.2K) unique bipolar disorder variants, and 1.1K (SD=0.4K) unique schizophrenia variants. Since the number of shared variants was almost equal to the total number of “causal” variants, rgs (0.78, SD=0.03) was similar to rg (0.73, SD=0.006), providing further evidence of the highly similar genetic architectures of these two psychotic disorders.
Extensive genetic overlap was also observed in the presence of weak rg. For example, schizophrenia and ADHD also shared large numbers of “causal” variants (5.4K, SD=0.4K), with only 0.1K unique ADHD variants, despite possessing the weakest rg (0.19, SD=0.010) and rgs (0.26, SD=0.02). This pattern of extensive genetic overlap but weak rg is indicative of mixed effect directions, supported by the MiXeR-estimated proportion of shared “causal” variants with concordant effects (0.58, SD=0.006).
LAVA local correlations provided further evidence of mixed effect directions across mental disorders (Figure 2). This was most evident between schizophrenia and depression (35 positively correlated and nine negatively correlated loci), although even schizophrenia and bipolar disorder were found to share a mixture of effect directions despite strong positive rg (123 positively correlated and five negatively correlated loci). Local correlations for schizophrenia and ADHD were not consistent with MiXeR-estimated mixed effect directions (10 positively correlated loci).
Given depression’s high polygenicity compared to less polygenic disorders like ADHD and bipolar disorder, there were large differences in the number of shared and unique “causal” variants. For example, depression and ADHD shared the smallest number of variants (4.4K, SD=0.4K), with many more unique depression variants (10.1K, SD=0.6K) than unique ADHD variants (1.2K, SD=0.5K). While they were moderately correlated at the genome-wide level (rg=0.45, SD=0.011), shared variants were strongly correlated (rgs=0.93, SD=0.07). AIC differences indicated that this analysis was underpowered to provide precise estimates. Nonetheless, there would still be strong rgs even in a scenario of complete genetic overlap (maximum rgs=0.72; see the Supplementary Methods section in the online supplement). A similar, although less pronounced, relationship was evident between depression and bipolar disorder. LAVA results supported these findings. All five significantly correlated loci for ADHD and depression were positively correlated, while 20 of 22 (91%) were positively correlated between depression and bipolar disorder.
Mental disorders and cognitive and personality traits.
Mental disorders displayed similarly pronounced genetic overlap with intelligence, educational attainment, neuroticism, and subjective well-being (Figure 3). As for mental disorders, AIC differences indicated that the MiXeR-modeled overlap was indistinguishable from maximum possible overlap for all analyses except depression and neuroticism, which displayed poor model fit (see Figure S4 and Tables S6 and S7 in the online supplement). Prominent mixed effect directions among shared “causal” variants were supported by LAVA local correlations (see the Supplementary Results section in the online supplement).

FIGURE 3. MiXeR Venn diagrams illustrating MiXeR-modeled genetic overlap, genome-wide genetic correlation, and genetic correlation of shared variants between bipolar disorder, ADHD, depression, and schizophrenia, cognitive and personality traits, and heighta
aCorrelations with cognitive traits are shown in panel A (intelligence [INT] and educational attainment [EDU]), personality traits are shown in panel B (neuroticism [NEUR] and subjective well-being [SWB]), and height is shown in panel C. The numbers of unique and shared “causal” variants are presented in thousands and are illustrated by the size of the unique and shared regions of the Venn diagrams. Genome-wide genetic correlations (rg) and genetic correlations of shared variants (rgs) are provided beneath each diagram and are represented by the shading of the unique (rg) and shared (rgs) regions, ranging from −1 (dark blue) to +1 (dark red). The SNP-based heritability (h2SNP) for each trait is provided beneath each trait label. All analyses besides neuroticism and depression and all height analyses had positive Akaike information criterion (AIC) differences when comparing modeled estimates to minimum possible overlap but negative compared to maximum possible overlap, indicating that the estimates were indistinguishable from maximum overlap. For neuroticism and depression and all analyses involving height, both AIC differences were positive. However, there was unstable model fit for neuroticism and depression compared to minimum possible overlap. These results should be interpreted with caution. Variation in polygenicity estimates for schizophrenia and subjective well-being are due to variation in univariate MiXeR results across the 20 iterations. ADHD=attention deficit hyperactivity disorder; BD=bipolar disorder; DEP=depression; SCZ=schizophrenia.
Genetic overlap with height.
Relative to height’s polygenicity (4.0K, SD=0.1K), there was minimal genetic overlap (0.7–1.1K) with large numbers of unique height (2.9K–3.3K) and mental disorder variants (4.9K–13.5K) (Figure 3; see also Table S8 in the online supplement). AIC differences indicated reliable estimates for all analyses. See the Supplementary Results section in the online supplement for more details.
Comparing MiXeR-estimated effect directions with LAVA local correlations.
The proportion of loci with positive genetic correlations was significantly correlated with the proportion of MiXeR-estimated “causal” variants with concordant effects (r=0.88, p<0.001), supporting the validity of MiXeR estimates of mixed effect directions (Figure 4). Complete LAVA results are presented in Table S9 in the online supplement.

FIGURE 4. Scatterplot comparing the proportion of LAVA-estimated independent genetic loci with significant positive genetic correlation against MiXeR-estimated proportion of shared “causal” variants with concordant effectsa
aEach individual point represents an individual pairwise analysis. Disorder-by-disorder analyses are clustered around high concordance, consistent with higher genetic correlation. Correlations for height by disorder/mental trait are clustered around 0.5 concordance, consistent with minimal genetic correlation and mixed effects. Correlations for disorder by mental trait and mental trait by mental trait are distributed across the spectrum of concordance. Both methods emphasize the presence of mixed effect directions across most analyses. However, note that LAVA local correlations were generally more extreme than MiXeR, possibly as a result of LAVA’s tendency to identify the most strongly correlated loci, which are most likely to be significant.
Discussion
In this cross-trait genetic analysis of ADHD, bipolar disorder, depression, schizophrenia, and cognitive and personality traits, we systematically quantified genetic architecture beyond genome-wide genetic correlations. We found marked differences in polygenicity but extensive genetic overlap across all mental disorders and cognitive and personality traits, with few disorder-specific variants. These findings were supported by LAVA local correlations, which also revealed patterns of mixed effect directions concealed by estimates of genome-wide genetic correlations. This indicates that, rather than a predominance of disorder-specific risk variants, there may be a set of highly pleiotropic variants that influence the risk of diverse mental disorders and related traits. By extension, phenotypic specificity may be largely driven by the distribution of effect sizes and effect directions across this pool of pleiotropic variants rather than variants unique to each phenotype (17). Building on previous work highlighting extensive overlap across mental disorders (13, 17), this represents a conceptual advance in our understanding of the genetic architecture of mental disorders, which may inform strategies for genetic discovery, biological characterization, and psychiatric nosology, providing the foundations for the development of precision psychiatry and treatment stratification across diagnostic boundaries.
First, we used univariate MiXeR to show that the genetic architectures of mental traits exhibit fundamental differences beyond heritability, with differences in polygenicity across the eight included traits. Among mental disorders, this was most pronounced between ADHD and depression, although lower polygenicities have recently been reported for migraine (23), cortical MRI measures, and other somatic traits (23–25). While the neurobiological and clinical implications of these findings are currently speculative, it is possible that polygenicity is a marker of heterogeneity at the neurobiological and/or clinical level. For example, ADHD may represent a more neurobiologically and/or clinically homogeneous population than depression. By extension, polygenicity may be a useful marker of genetic heterogeneity, which could be used to test the effect of biomarkers or clinically defined subgroups on the genetic makeup of a given disorder. Differences in polygenicity may also be due to differences in biological complexity or negative selection (26, 27). More deeply phenotyped samples and improved functional characterization of genetic loci are required to provide further insights.
Using bivariate MiXeR, we found extensive genetic overlap across mental disorders and cognitive and personality traits. This pattern was present in scenarios of weak genome-wide genetic correlation, such as depression and cognition, as well as strong genome-wide correlations, such as bipolar disorder and schizophrenia. The former is indicative of a balance of shared variants with concordant and discordant effect directions on each trait, a pattern we replicate using LAVA. These findings build on previous evidence demonstrating extensive genetic overlap between schizophrenia, bipolar disorder, depression, and intelligence, with widespread mixed effect directions (11, 17). Together, this indicates that most common variants that influence the genetic risk for diverse mental phenotypes are highly pleiotropic and may have both risk-enhancing and risk-reducing effects on different disorders and traits. Consequently, it may be the specific distribution of effect sizes of highly pleiotropic variants that predominantly contributes to the development of a given mental disorder rather than a set of phenotype-specific variants.
This conceptual insight extends the current theories of genetic susceptibility for mental traits and disorders. These are traditionally based on the assumption that a specific set of genes is implicated for a given mental disorder, with varying degrees of genetic overlap across disorders, reflected by their genetic correlations (8, 16, 28). However, this is inconsistent with the extent of genetic overlap observed when accounting for mixed effect directions, which may provide a better conceptual framework for the neurobiology of mental traits and disorders. The brain is a complex organ with abundant pleiotropy across different brain regions (29), brain functions (30), and mental traits (31). Thus, it is likely that differences in activity in the same neurobiological systems alter diverse mental traits and disorders, but the magnitude and direction of effect may differ across and within diagnostic categories, exemplified by evidence of increased glutamatergic neurotransmission in schizophrenia (32) but decreased transmission in depression (33). This is also consistent with the fact that most genetic variants associated with mental disorders reside within regulatory elements rather than coding regions (34). Allelic variation may therefore “tune” neurobiological pathways in different directions, resulting in phenotypic differences mediated by the same pathways (35). By applying statistical tools that allow for mixed effect directions and estimation of effect sizes, new insight into neurobiological substrates for mental disorders is possible.
These findings also have clinical implications. First, evidence of extensive genetic overlap with limited trait specificity underscores the limited extent to which our current categorical diagnostic system maps onto underlying biological processes (36). These findings may therefore be more consistent with dimensional approaches to psychiatric nosology, which allow for specific combinations of symptoms as well as interactions with other mental traits, as proposed by the Research Domain Criteria (RDoC) or Hierarchical Taxonomy of Psychopathology (HiTOP) frameworks (37, 38). This may also help to explain the large degree of comorbidity and the prominence of overlapping clinical characteristics observed across mental disorders. Alternatively, once greater proportions of the SNP-based heritability of mental disorders have been characterized, it may be possible to parse the heritable component into constituent biological processes. This may enable construction of a personalized, biologically informed diagnostic system, similar to the “palette model” proposed for diabetes (39). As the era of large-scale case-control GWASs transitions toward deeply phenotyped clinical and population samples (40), it will be of great interest whether subphenotyping results in more specific genetic signals. This will also be highly relevant for the clinical application of polygenic risk scores, which require not only improved explained variance but also the ability to discriminate across diagnostic groups or clinically relevant decisions.
Despite the pervasive overlap, the number of shared and unique “causal” variants varied across phenotypic pairs, sometimes revealing the presence of strongly correlated shared variants despite moderate genome-wide genetic correlation. This pattern was most evident between ADHD and depression, a finding supported by LAVA. This suggests that although a large proportion of depression-associated variants are not associated with ADHD, those that are shared have highly similar effects. This mirrors recent findings from a genomic structural equation modeling approach that clustered depression with neurodevelopmental disorders, including ADHD (8). This may indicate distinct clinical subgroups with higher rates of comorbidity, or shared involvement of specific molecular mechanisms with similar effects on both disorders. Further investigation of the shared genetic architecture of ADHD and depression may prove fruitful for the identification of underlying biological mechanisms and new treatment targets (41–43).
There was substantially less genetic overlap between mental disorders and height, with approximately 1,000 shared “causal” variants across all pairwise analyses. This may represent nonspecific “background” genetic overlap observed across all polygenic traits, or, alternatively, it may capture highly pleiotropic transcription factors or regulatory elements that influence diverse traits across distinct tissues and systems. (See the Supplementary Discussion section in the online supplement for additional discussion of the relevance of our findings to the p factor hypothesis.)
This study had limitations. Only samples of European ancestry and common genetic variants were included, because of limited availability of trans-ancestral and sequenced samples. Both educational attainment and subjective well-being are influenced by social factors, and neither can be considered direct measures of cognition or personality. Nonetheless, there is a lack of well-powered GWASs of more specific measures within either domain, and these measures provide useful insights alongside intelligence and neuroticism. We also cannot exclude the possibility of comorbidity or misdiagnosis across psychiatric samples. However, the extent of the overlap observed and its consistency across mental traits indicate that this alone cannot explain our findings. In addition, for all pairwise analyses of mental disorders and related traits, besides depression and neuroticism, the AIC differences were negative when compared to maximum possible overlap. This indicates that MiXeR-modeled estimates of genetic overlap are indistinguishable from maximum overlap as measured by AIC, and so must be interpreted with caution. It is important to note, however, that the overlaps presented are still the best-fitting estimates as determined by maximum likelihood estimation. Finally, given the need to maximize sample sizes, it was not possible to perform replication analyses in independent samples. Nonetheless, we used both MiXeR and LAVA to triangulate our findings using different statistical frameworks. Our univariate measures are further supported by recent findings using Fourier mixture regression (44), which predicts required sample sizes for a given proportion of explained heritability, like MiXeR (see the online supplement). For schizophrenia, bipolar disorder, and neuroticism, which were common to both analyses, there was high concordance of predicted sample sizes required to explain 90% SNP heritability.
In summary, we have used advanced statistical modeling to demonstrate both considerable similarities yet also fundamental differences in the genetic architecture of ADHD, bipolar disorder, schizophrenia, and depression, alongside cognitive and personality traits. Despite extensive genetic overlap and few trait-specific variants, there were distinct patterns of genetic correlations with widespread mixed effect directions. This suggests that it is the specific distribution of effect sizes of highly pleiotropic variants that predominantly contribute to the development of mental disorders and related traits, rather than a set of disorder-specific variants. This represents a conceptual advance in our understanding of the genetic risk of mental disorders, suggesting that normative and pathological mental traits, and the biological processes underlying them, exist on the same dimensions in genomic space. These findings place greater emphasis on efforts to improve the specificity of psychiatric diagnostic categories, potentially offering a means to test the genetic heterogeneity of hypothesized subgroups through estimates of polygenicity. This may aid efforts to refine the current nosological system, with potential for improved translation of genetic findings into clinically meaningful prediction and stratification tools, and improved drug target identification.
1. : Heritability of schizophrenia and schizophrenia spectrum based on the nationwide Danish Twin Register. Biol Psychiatry 2018; 83:492–498Crossref, Medline, Google Scholar
2. : A population-based heritability estimate of bipolar disorder in a Swedish twin sample. Psychiatry Res 2019; 278:180–187Crossref, Medline, Google Scholar
3. : The genetic epidemiology of treated major depression in Sweden. Am J Psychiatry 2018; 175:1137–1144Link, Google Scholar
4. : Genetics of attention deficit hyperactivity disorder. Mol Psychiatry 2019; 24:562–575Crossref, Medline, Google Scholar
5. : Psychiatric genetics and the structure of psychopathology. Mol Psychiatry 2019; 24:409–420Crossref, Medline, Google Scholar
6. : Genome-wide polygenic scores for common diseases identify individuals with risk equivalent to monogenic mutations. Nat Genet 2018; 50:1219–1224Crossref, Medline, Google Scholar
7. : Pleiotropy and cross-disorder genetics among psychiatric disorders. Biol Psychiatry 2021; 89:20–31Crossref, Medline, Google Scholar
8. : Genomic relationships, novel loci, and pleiotropic mechanisms across eight psychiatric disorders. Cell 2019; 179:1469–1482.e11Crossref, Medline, Google Scholar
9. : Identification of genetic overlap and novel risk loci for attention-deficit/hyperactivity disorder and bipolar disorder. Mol Psychiatry 2021; 26:4055–4065Crossref, Medline, Google Scholar
10. : Improved detection of common variants associated with schizophrenia and bipolar disorder using pleiotropy-informed conditional false discovery rate. PLoS Genet 2013; 9:e1003455Crossref, Medline, Google Scholar
11. : Genetic loci shared between major depression and intelligence with mixed directions of effect. Nat Hum Behav 2021; 5:795–801Crossref, Medline, Google Scholar
12. : Genome-wide analysis reveals extensive genetic overlap between schizophrenia, bipolar disorder, and intelligence. Mol Psychiatry 2020; 25:844–853Crossref, Medline, Google Scholar
13. : Characterising the shared genetic determinants of bipolar disorder, schizophrenia, and risk-taking. Transl Psychiatry 2021; 11:466Crossref, Medline, Google Scholar
14. : Polygenicity in psychiatry: like it or not, we have to understand it. Biol Psychiatry 2021; 89:2–4Crossref, Medline, Google Scholar
15. : An atlas of genetic correlations across human diseases and traits. Nat Genet 2015; 47:1236–1241Crossref, Medline, Google Scholar
16. : Analysis of shared heritability in common disorders of the brain. Science 2018; 360:eaap8757Crossref, Medline, Google Scholar
17. : The polygenic architecture of schizophrenia: rethinking pathogenesis and nosology. Nat Rev Neurol 2020; 16:366–379Crossref, Medline, Google Scholar
18. : Characterizing the genetic overlap between psychiatric disorders and sleep-related phenotypes. Biol Psychiatry 2021; 90:621–631Crossref, Medline, Google Scholar
19. : Bivariate causal mixture model quantifies polygenic overlap between complex traits beyond genetic correlation. Nat Commun 2019; 10:2417Crossref, Medline, Google Scholar
20. : An integrated framework for local genetic correlation analysis. Nat Genet 2022; 54:274–282Crossref, Medline, Google Scholar
21. : Extensive bidirectional genetic overlap between bipolar disorder and cardiovascular disease phenotypes. Transl Psychiatry 2021; 11:407Crossref, Medline, Google Scholar
22. : LD score regression distinguishes confounding from polygenicity in genome-wide association studies. Nat Genet 2015; 47:291–295Crossref, Medline, Google Scholar
23. : Dissecting the shared genetic basis of migraine and mental disorders using novel statistical tools. Brain 2022; 145:142–153Crossref, Medline, Google Scholar
24. : Genetic association between schizophrenia and cortical brain surface area and thickness. JAMA Psychiatry 2021; 78:1020–1030Crossref, Medline, Google Scholar
25. : Beyond SNP heritability: polygenicity and discoverability of phenotypes estimated with a univariate Gaussian mixture model. PLoS Genet 2020; 16:e1008612 Crossref, Medline, Google Scholar
26. : Extreme polygenicity of complex traits is explained by negative selection. Am J Hum Genet 2019; 105:456–476Crossref, Medline, Google Scholar
27. : Linkage disequilibrium–dependent architecture of human complex traits shows action of negative selection. Nat Genet 2017; 49:1421–1427Crossref, Medline, Google Scholar
28. : Identification of risk loci with shared effects on five major psychiatric disorders: a genome-wide analysis. Lancet 2013; 381:1371–1379Crossref, Medline, Google Scholar
29. : Vertex-wise multivariate genome-wide association study identifies 780 unique genetic loci associated with cortical morphology. Neuroimage 2021; 244:118603Crossref, Medline, Google Scholar
30. : Genetic overlap between multivariate measures of human functional brain connectivity and psychiatric disorders. medRxiv, January 10, 2022. doi: 10.1101/2021.06.15.21258954Google Scholar
31. : Multivariate genetic analysis of personality and cognitive traits reveals abundant pleiotropy and improves prediction. bioRxiv, March 9, 2022. doi: 10.1101/2022.02.28.481967 Google Scholar
32. : Glutamate hypothesis in schizophrenia. Psychiatry Clin Neurosci 2019; 73:204–215Crossref, Medline, Google Scholar
33. : Glutamate and gamma-aminobutyric acid systems in the pathophysiology of major depression and antidepressant response to ketamine. Biol Psychiatry 2017; 81:886–897Crossref, Medline, Google Scholar
34. : Genetic control of expression and splicing in developing human brain informs disease mechanisms. Cell 2019; 179:750–771.e22Crossref, Medline, Google Scholar
35. : Shared molecular neuropathology across major psychiatric disorders parallels polygenic overlap. Science 2018; 359:693–697Crossref, Medline, Google Scholar
36. : Disorders and borders: psychiatric genetics and nosology. Am J Med Genet B Neuropsychiatr Genet 2013; 162B:559–578Crossref, Medline, Google Scholar
37. : The NIMH Research Domain Criteria (RDoC) project: implications for genetics research. Mamm Genome 2014; 25:23–31Crossref, Medline, Google Scholar
38. : The hierarchical taxonomy of psychopathology (HiTOP): a dimensional alternative to traditional nosologies. J Abnorm Psychol 2017; 126:454–477Crossref, Medline, Google Scholar
39. : Painting a new picture of personalised medicine for diabetes. Diabetologia 2017; 60:793–799Crossref, Medline, Google Scholar
40. : The UK Biobank resource with deep phenotyping and genomic data. Nature 2018; 562:203–209Crossref, Medline, Google Scholar
41. : Druggable genome in attention deficit/hyperactivity disorder and its co-morbid conditions: new avenues for treatment. Mol Psychiatry 2021; 26:4004–4015Crossref, Medline, Google Scholar
42. : Translating genome-wide association findings into new therapeutics for psychiatry. Nat Neurosci 2016; 19:1392–1396Crossref, Medline, Google Scholar
43. : Identifying nootropic drug targets via large-scale cognitive GWAS and transcriptomics. Neuropsychopharmacology 2021; 46:1788–1801Crossref, Medline, Google Scholar
44. : The distribution of common-variant effect sizes. Nat Genet 2021; 53:1243–1249Crossref, Medline, Google Scholar
45. : Mapping genomic loci implicates genes and synaptic biology in schizophrenia. Nature 2022; 604:502–508Crossref, Medline, Google Scholar
46. : Genome-wide association study of more than 40,000 bipolar disorder cases provides new insights into the underlying biology. Nat Genet 2021; 53:817–829Crossref, Medline, Google Scholar
47. : Genome-wide association analyses identify 44 risk variants and refine the genetic architecture of major depression. Nat Genet 2018; 50:668–681Crossref, Medline, Google Scholar
48. : Discovery of the first genome-wide significant risk loci for attention deficit/hyperactivity disorder. Nat Genet 2019; 51:63–75Crossref, Medline, Google Scholar
49. : Genome-wide association meta-analysis in 269,867 individuals identifies new genetic and functional links to intelligence. Nat Genet 2018; 50:912–919Crossref, Medline, Google Scholar
50. : Gene discovery and polygenic prediction from a genome-wide association study of educational attainment in 1.1 million individuals. Nat Genet 2018; 50:1112–1121Crossref, Medline, Google Scholar
51. : Meta-analysis of genome-wide association studies for neuroticism in 449,484 individuals identifies novel genetic loci and pathways. Nat Genet 2018; 50:920–927Crossref, Medline, Google Scholar
52. : Genetic variants associated with subjective well-being, depressive symptoms, and neuroticism identified through genome-wide analyses. Nat Genet 2016; 48:624–633Crossref, Medline, Google Scholar
53. : Meta-analysis of genome-wide association studies for height and body mass index in ∼700000 individuals of European ancestry. Hum Mol Genet 2018; 27:3641–3649Crossref, Medline, Google Scholar